
-
Blog
-
About us
- Awards
- Issues
- Contact Subscribe
Blog page


Our Top Categories
Credential Fraud and the Modern Hiring Challenge
Top Read In Category
Is Your Marketing Strategy Built for Scale – Or Just Survival?
Top Read In Category
How Smart Table Presentation Helps Restaurants Build a Stronger Brand
Top Read In Category
‘Tasks That Took Days Now Take Minutes’: Gil Baram on the AI Cyber Threat
Top Read In Category
Ranking the Top Coaching Platforms This Year by Features
Top Read In Category
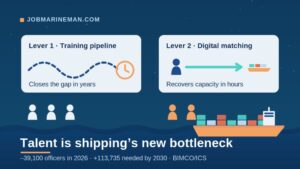
When Talent Becomes the Bottleneck: A Lesson in Workforce Strategy from Global Shipping
Top Read In Category